Readme for the Demo Experiment Files
The HCoV (human coronavirus) protein microarray is a specialized tool used in examining the serological recognition of various coronavirus species in COVID-19 patients. The HCoV arrays consisted of 20 viral antigens and 10 control signals and is printed in triplicate in each block (14 identical blocks per 75 mm x 25 mm slide). Serum samples from 32 COVID-19 patients (exp group) and 36 healthy controls (ctrl group) were incubated in separate blocks. The serum IgG signals were visualized with Cy3-labeled anti-human IgG and scanned with the 550nm channel. The serum IgA signals were visualized with Cy5-labeled anti-human IgA and scanned with the 650nm channel. Serum profiling from each subject was split using the ”Chip Block Handling” function of BAPCP and exported into .gpr files (the experiment and control groups).
Steps to Use BAPCP
BAPCP Function1/3: Two-group/Multiple-group Chip Data Analysis
BAPCP Function2: Chip Block Handling
BAPCP Function1/3: Two-group/Multiple-group Chip Data Analysis
In this function, users can carry out the protein chip analysis for biomarker extraction using BAPCP:
-
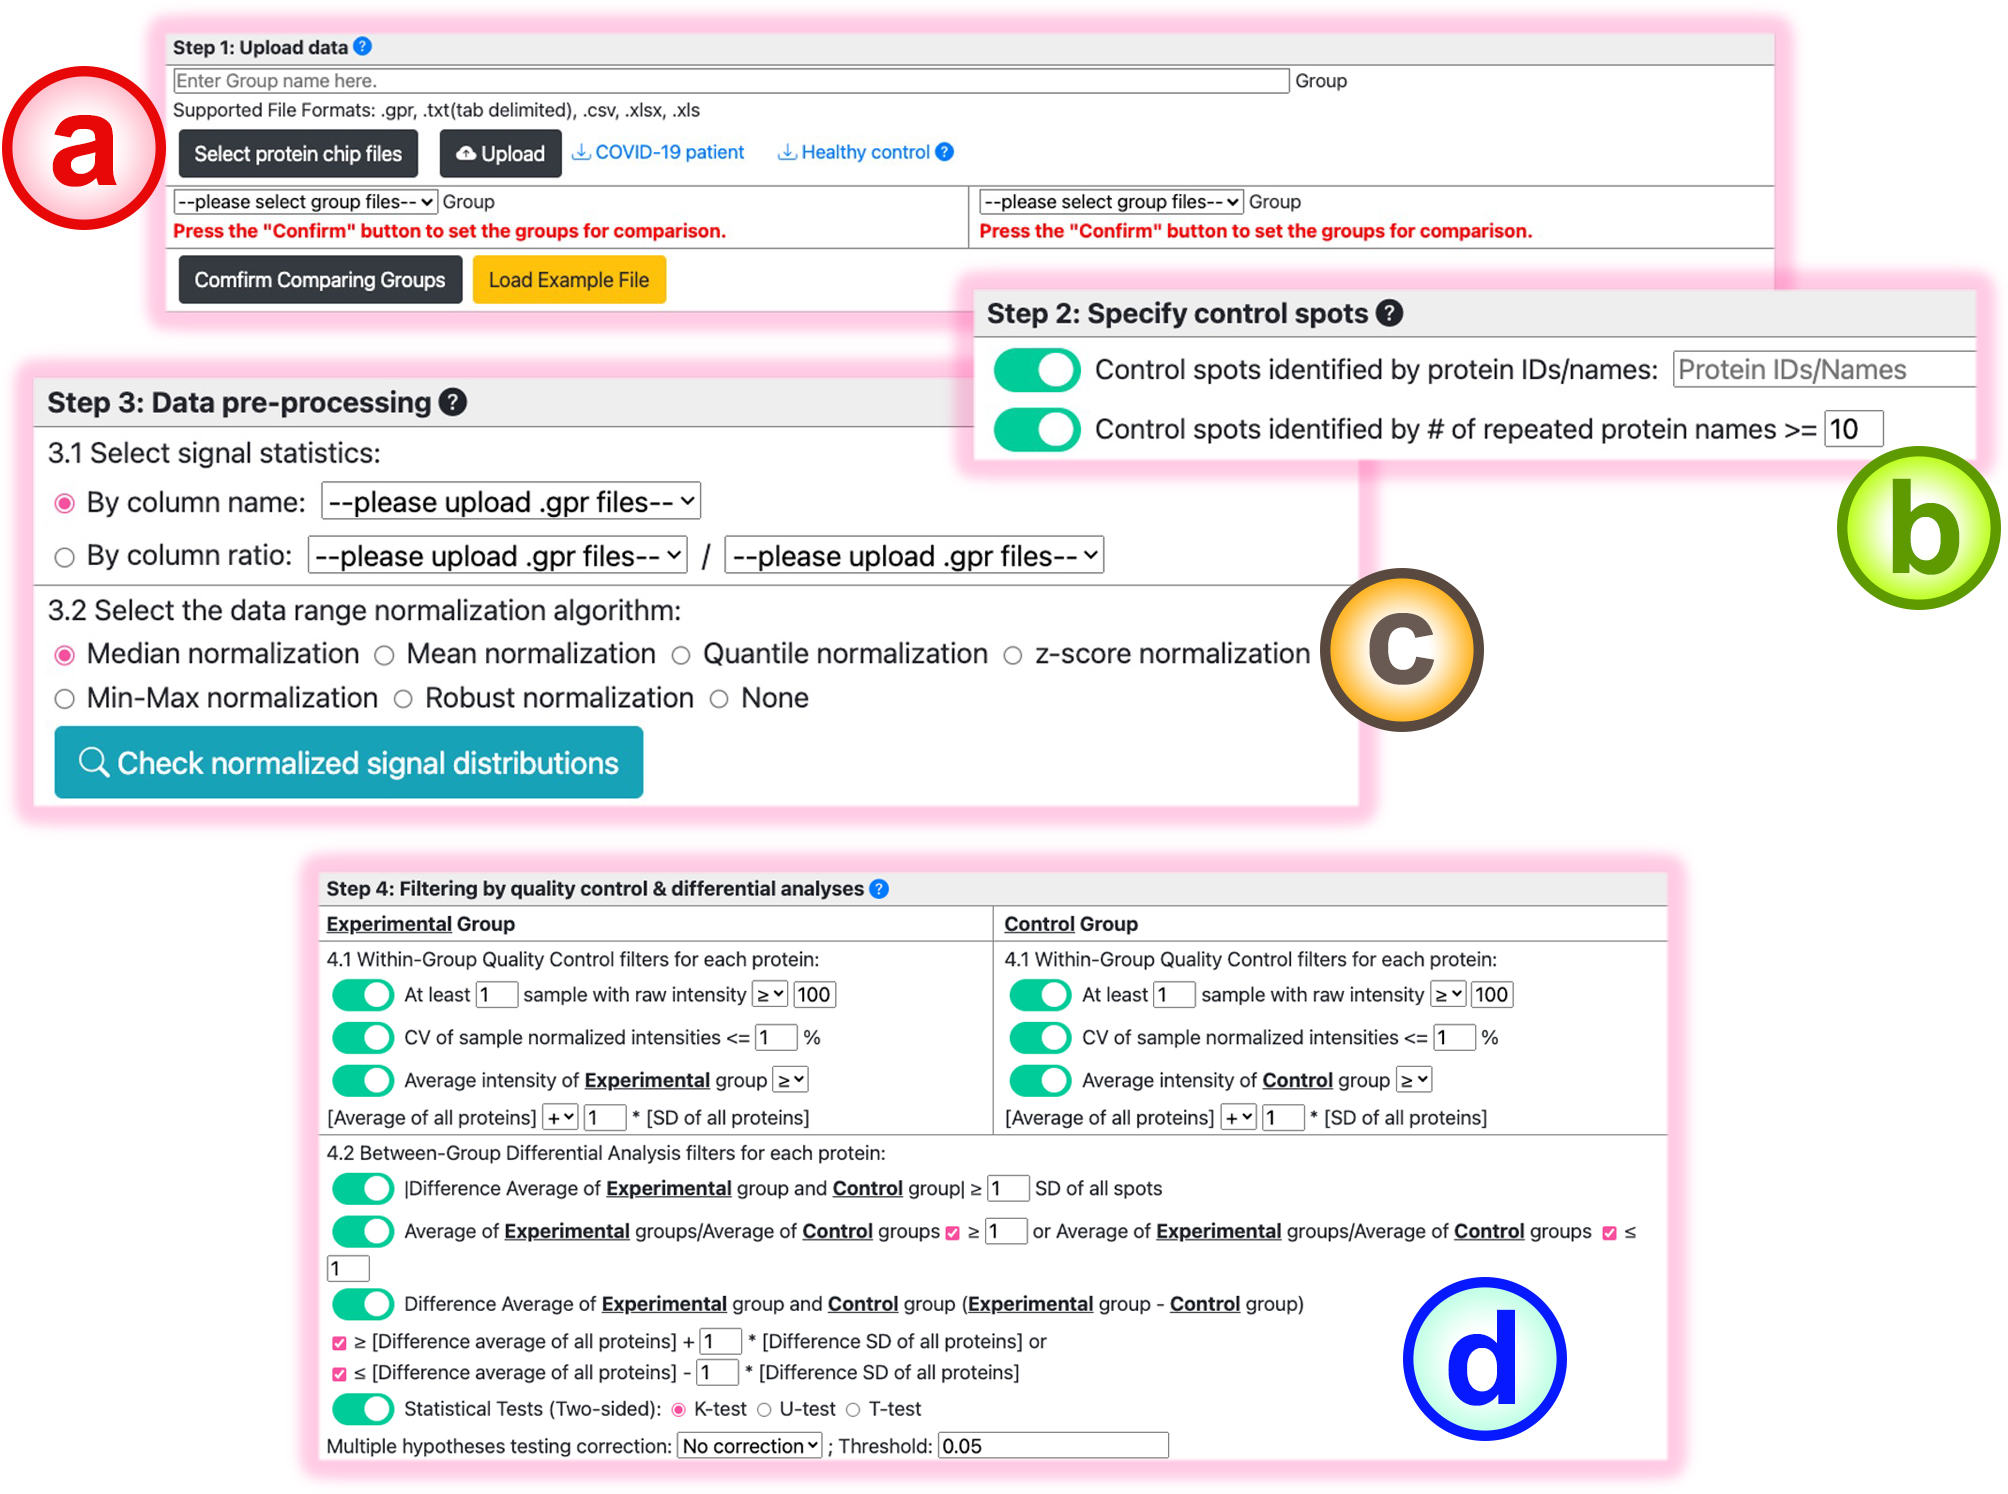
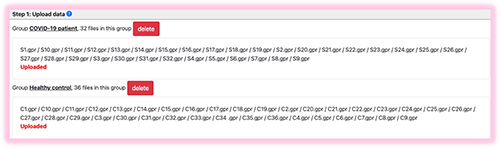
Upload the .gpr/.xls/.csv/.xlsx files for multiple experimental conditions. Users first click the "Select protein chip files" button to choose the result files. After selecting the files for each condition, click the "Upload" button to upload the files to BAPCP. Users need to name every condition. The uploaded files will be listed as follows.
After uploading the results, users need to specify the comparison groups for the subsequent analysis.
- Users can type in the control protein IDs. And protein IDs that distribute in more than 10 spots can also be assigned as the control signals.
-
Users must first select the signal statistic used for subsequent analyses. And 7 normalization methods are provided for users to range-aligned the intensity distributions among different runs.
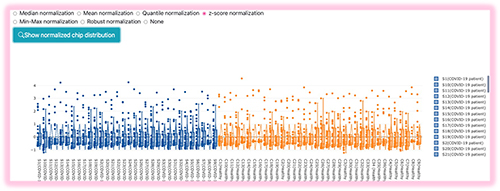
BAPCP provides a box-plot visualization to help users select the appropriate normalization method. Select the intended normalization method and press the "Check normalized signal distributions" button, then the box plot distributions of the samples will be provided.
- In Function1 (two-group data analysis): to extract biomarkers from the two-grouped experiments, users can request the quality control criteria and differential analysis filters to obtain confident differential proteins.
In Function 3 (Multiple-group data analysis): users can select the parametric ANOVA test or non-parametric Kruskal-Wallis H-test to check if the protein spots are differentially expressed among multiple conditions.
The Query Results
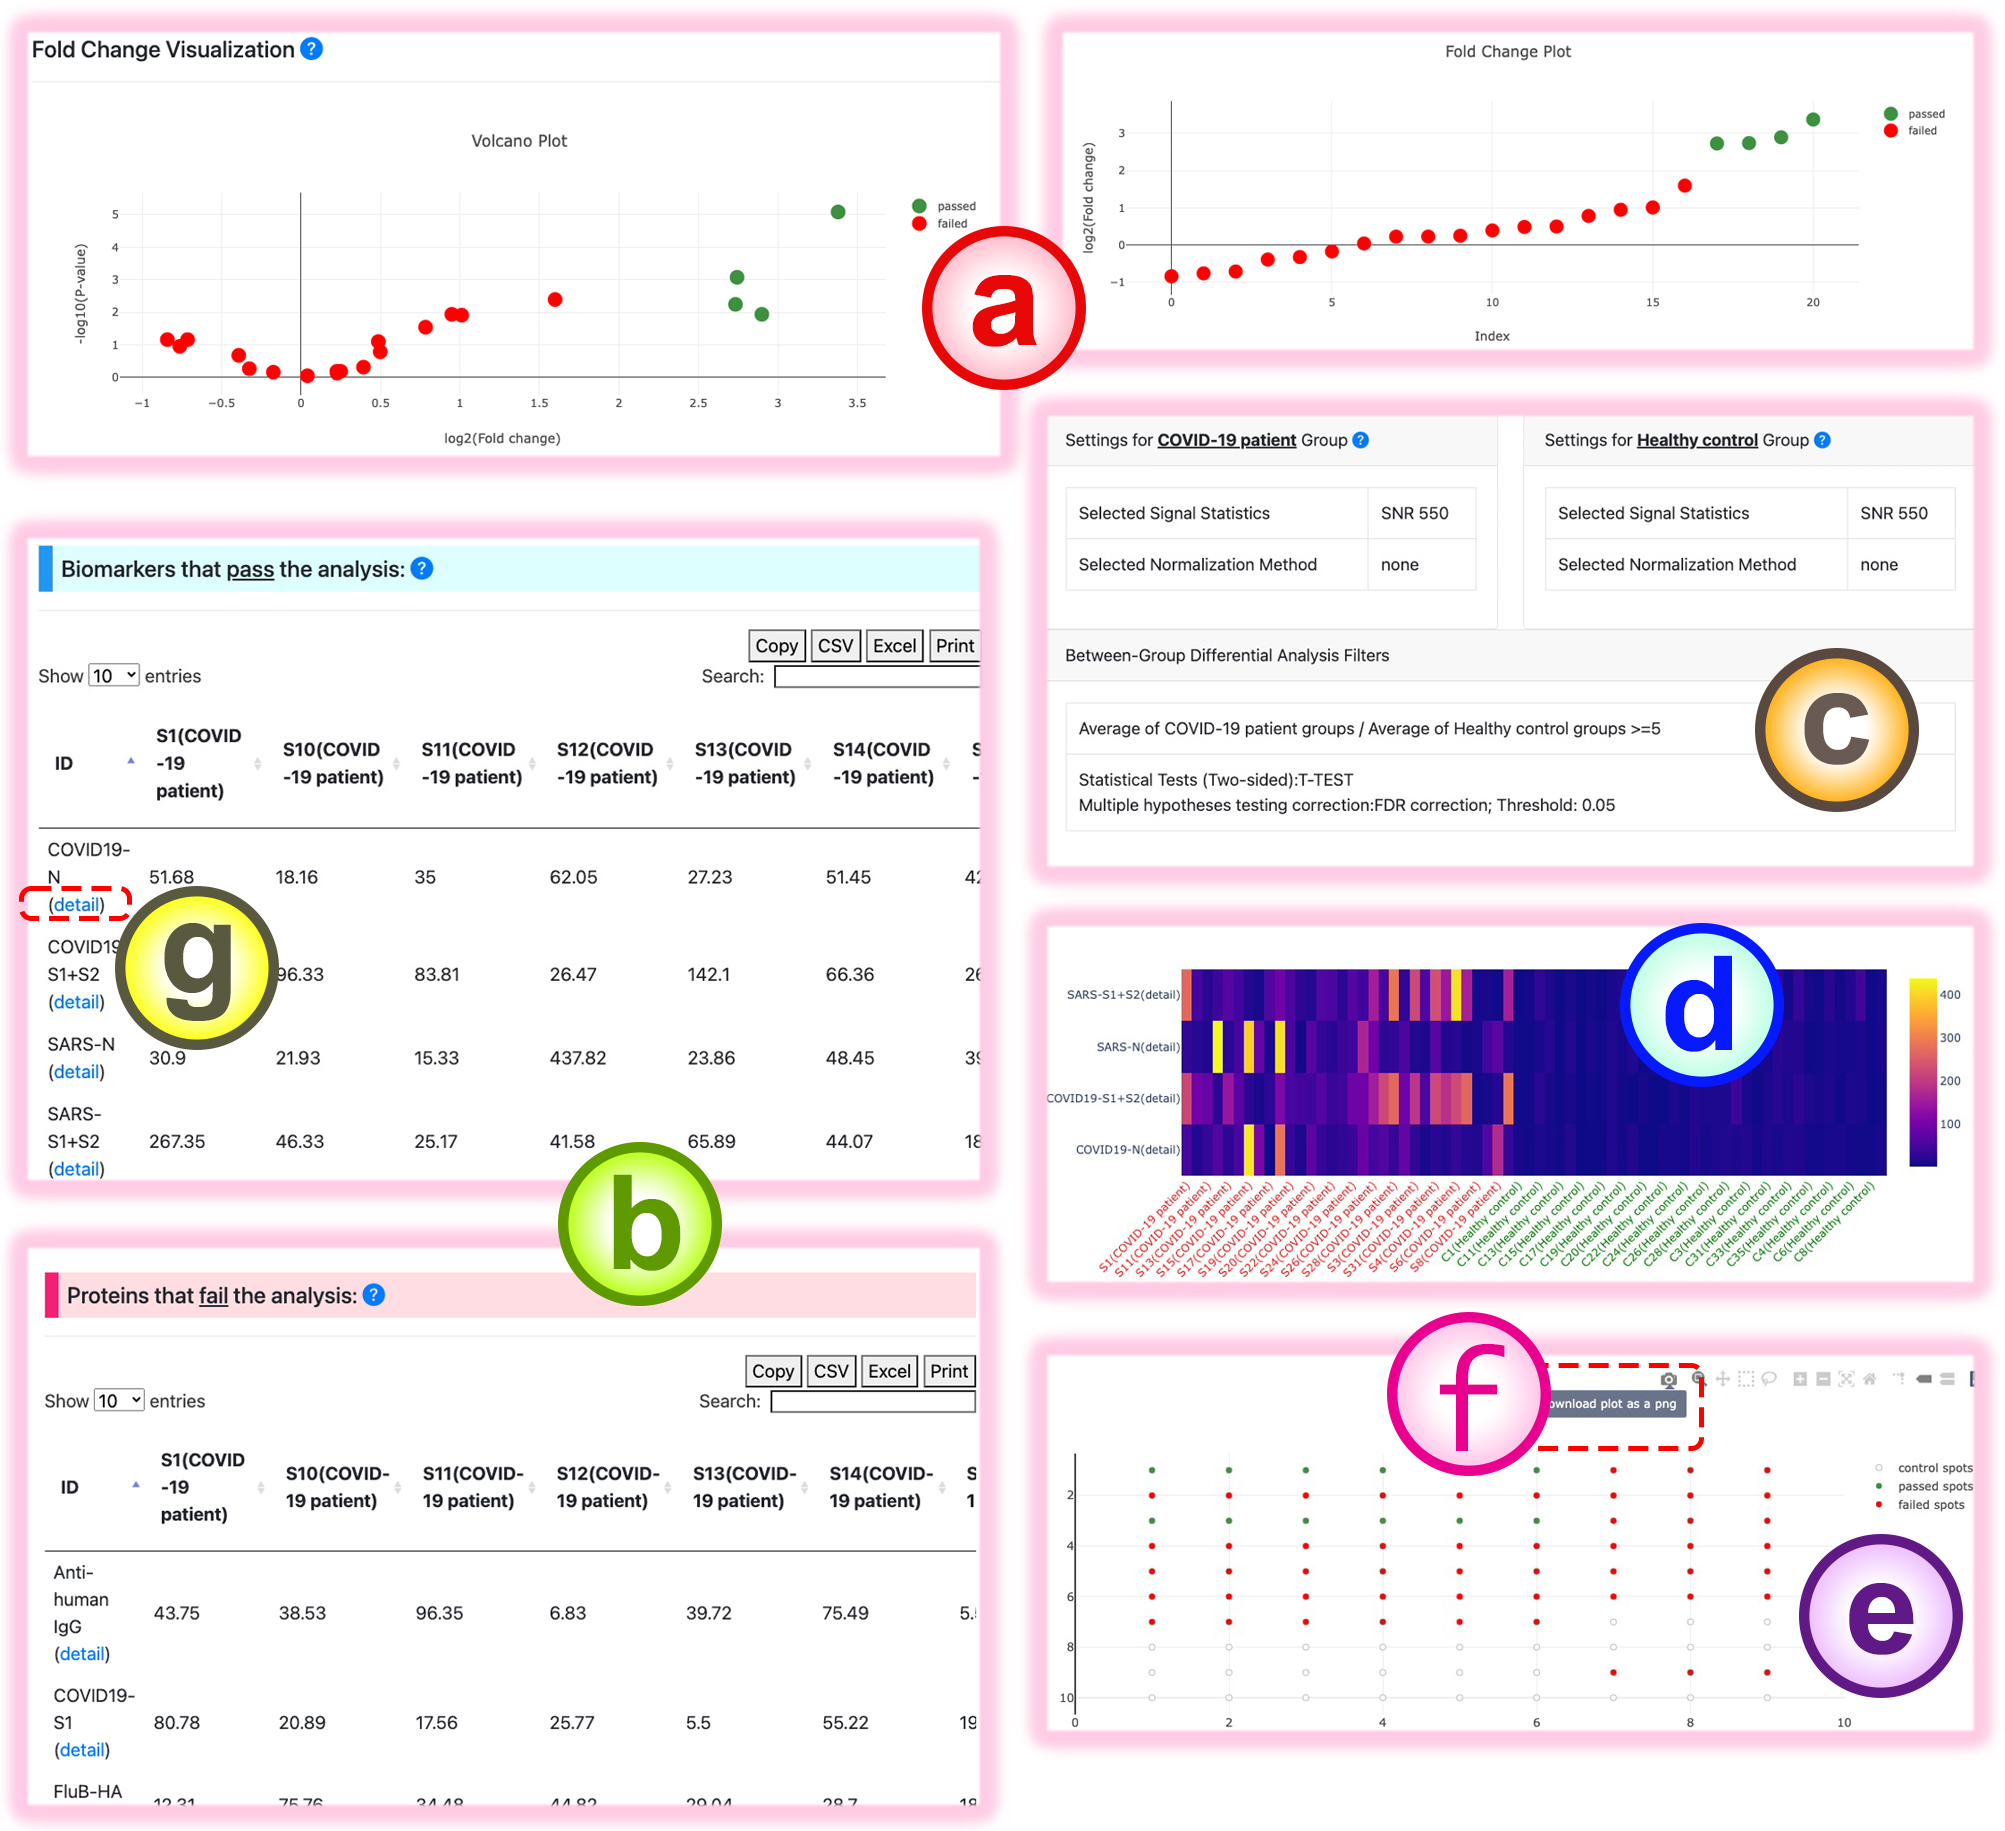
The computed intersection results based on the user-selected filters are listed in the biomarker query result table:
- The fold change visualizations of the protein signals in the provided comparison groups.
- The biomarkers that pass the quality control and differential analysis criteria are listed in the biomarker table.
- The summary of the user-specified conditions.
- Heatmap visualization of the sample intensities of the differentially observed proteins between the two conditions.
- The chip location graph of the given experiment.
Red spots: chip spots that fail the condition.
Green spots: chip spots that pass the specified criteria.
Gray spots: controls. - The figures can be downloaded via the button in the upper-right corner. And the table can also be downloaded using the "CSV"/"Excel" button in its upper-left corner.
- To access the detail page for each protein, click the "detail" link below the protein name of interest.
The Detail Page
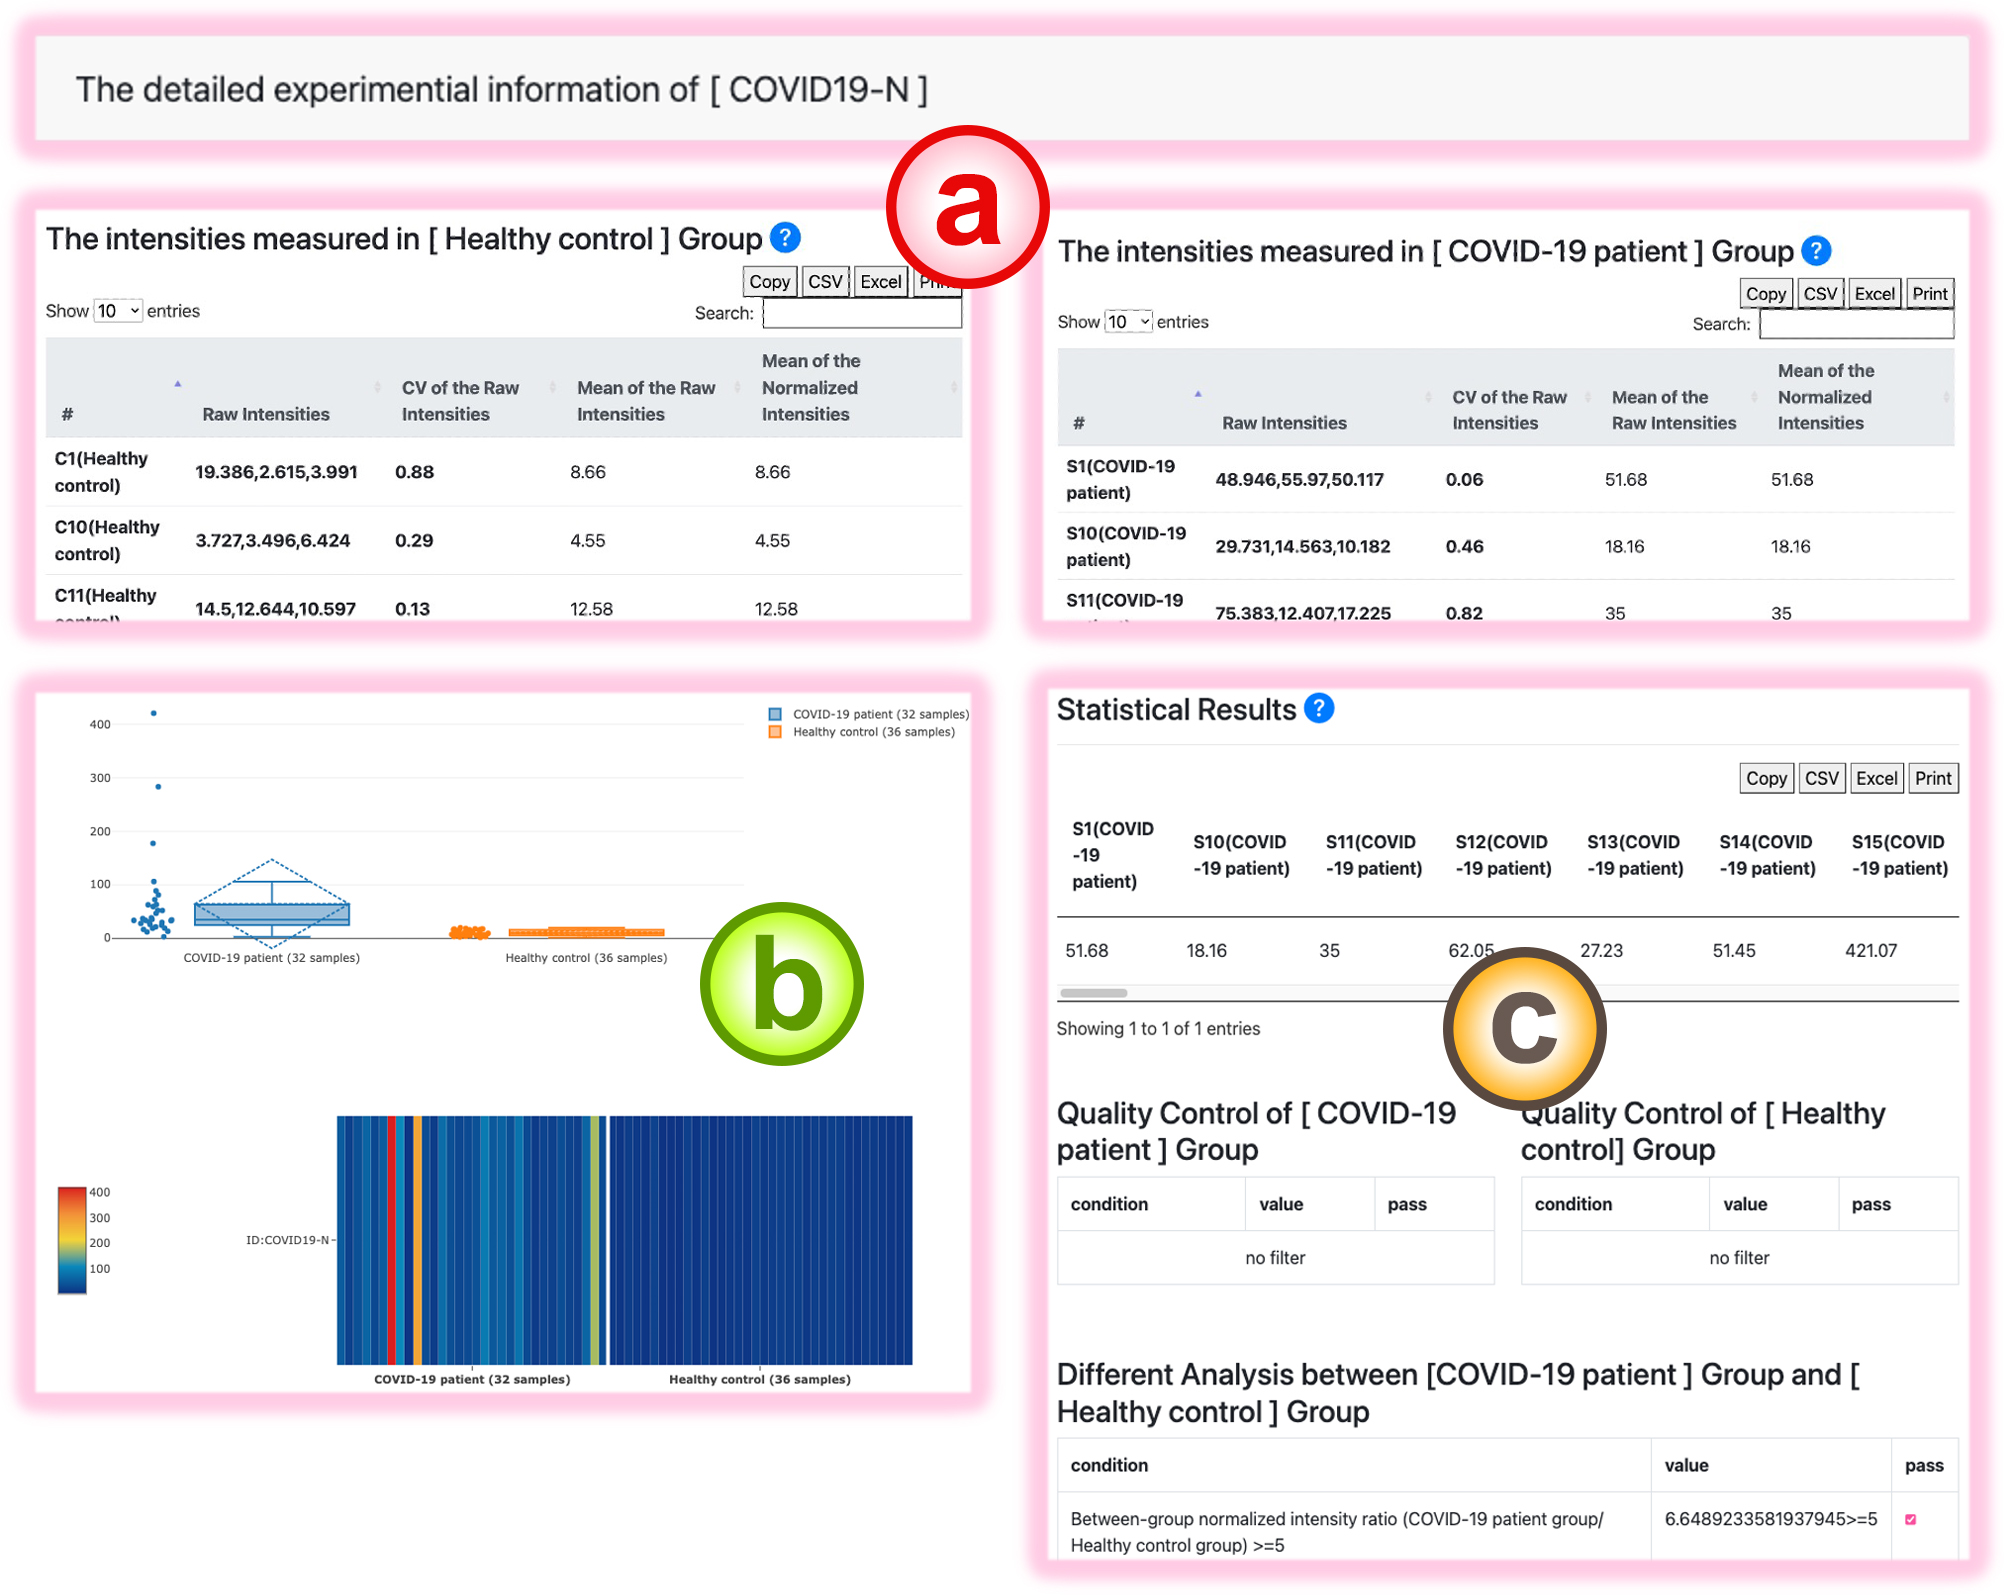
The detail page of the chosen protein contains the spot intensity information for the selected protein in the two conditions.
- The raw and normalized spot intensities of this protein in different samples of the two conditions.
- The box plot and heatmap visualizations of the normalized sample protein intensities.
- The quality control and differential analysis check for this protein between the two given experimental conditions.
BAPCP Function2: Chip Block Handling
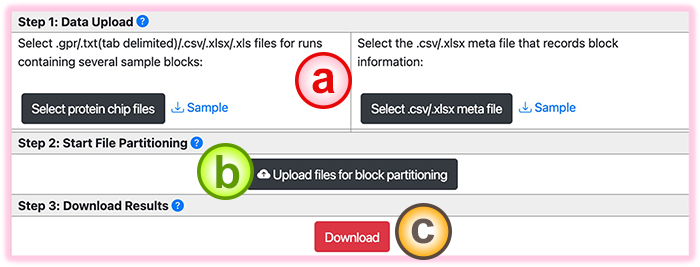
BAPCP can help handle the protein chip experiments that consist of several samples within individual slides. This function partitions the sample blocks into separate .gpr files.
- Users first select the block files (.gpr/.csv/.xls/.xlsx) from the chip results containing several blocks. Then a metafile that records the block information must be specified.
- Click the "Upload files for block partition” button to upload and start the partition process.
- The resulting files are zipped into one .zip file for users. Click the "Download" button to download this .zip file. The results are sepearate .gpr files for the containing blocks.