About KDmarkers
Construction of KDmarkers
About KDmarkers
What is Kawasaki disease (KD)?
Kawasaki disease (KD), also called Kawasaki syndrome or mucocutaneous lymph node syndrome (MCLS), is an acute-onset systemic vasculitis of small to medium-sized vessels that affects multiple systems. KD is the most common acute coronary vasculitis disease in children, especially for those less than five years old. Its incidence has been attributed to the combined effects of infection, genetics, and immunity. The etiopathogenesis of KD remains unknown. In 1974, Dr. Tomisaku Kawasaki first described 50 cases of KD using the English language in Japan. The diagnosis criteria of KD are fever for more than five days with 4 of the 5 major clinical symptoms (Kuo's Mnemonic), including diffuse mucosal inflammation, bilateral conjunctivitis, neck lymphadenopathy, indurative edema of the hands and feet associated with peeling of the finger tips, and polymorphic skin rashes. The standard treatment is high-dose intravenous immunoglobulin (IVIG) and aspirin.
Motivation of KDmarkers
Diagnosis of KD is currently based on subjective clinical symptoms. There is still no available molecular diagnosis kit now. Our previous studies found that IVIG treatment can significantly alter the methylation landscape and expression level of specific genes in KD patients, shedding light on epigenetic evidence on KD markers. We have adopted Illumina Human Methylation450 BeadChip and Affymetrix GeneChIP® Human Transcriptome Array 2.0 to assess the methylation pattern of known gene CpG islands and gene expression of blood samples of KD patients and control subjects, respectively. In order to provide a global view for epigenetic and expression analysis in KD, we constructed the KDmarkers database to facilitate comprehensive analysis for potential molecular KD markers.
What is KDmarkers?
KDmarkers is a database that deposits the transcriptome gene expression and CpG methylation pattern of samples of KD patients and control subjects. Researchers can search for genes with either differential epigenetic methylation patterns or differential gene expression levels (or both) between KD patients and control subjects in this database. These extracted genes can serve as potential markers for the molecular diagnosis of KD. Three functions were implemented in KDmarkers to facilitate researchers and clinicians to investigate KD-related genes:
(i) Search for KD markers;
(ii) Search potentially affected patient groups;
(iii) Visualize Raw Data.
Both the methylation pattern and the expression pattern of the human genome can be analyzed simultaneously in KDmarkers. Elevated methylation levels combined with decreased mRNA expression level help indicate the functional genes in the KD diagnosis, treatment, and prognostic studies.
Construction of KDmarkers
Construction of KDmarkers
The construction of KDmarkers can be divided into three different parts:
(I) Experimental data collection
(II) Data preprocessing
(III) Differential value comparison of chip beads
(IV) Bead-gene mapping
(I) Experimental data collection
(II) Data preprocessing
(III) Differential value comparison of chip beads
(IV) Bead-gene mapping
Experimental data collection
The genomic human transcriptome methylation data and mRNA expression data were measured from the whole blood samples followed by white blood cell enrichment. The blood samples used for genome-wide methylation level probing were collected from 24 pre-IVIG KD patients (before IVIG treatment), 12 post-IVIG KD patients (at least 3 weeks after IVIG treatment), 12 healthy children, and 12 fever control subjects. And the blood samples used for expression level analysis were gathered from 50 pre-IVIG KD patients (before IVIG treatment), 18 post-IVIG KD patients (at least 3 weeks after IVIG treatment), 18 healthy children, and 18 fever control subjects. Post-intravenous immunoglobulin (IVIG) treatment KD samples were gathered from the same KD patients that were given a high-dose IVIG treatment (2 g/kg) over 12 hours. The diagnosis of KD patients followed the American Heart Association KD criteria. The patient sample collection was approved by the Institutional Review Board of Chang Gung Memorial Hospital (IRB No.:101-4618A3), and the written informed consents from the parents/guardians of the patients were also ensured. Overall the samples can be categorized into four different groups: the normal controls, the fever controls, the KD samples before IVIG treatment, and the KD samples after IVIG treatment.
The samples gathered for genome-wide methylation profiling were treated with bisulfite to convert non-methylated cytosine into uracil for methylated DNA extraction. These DNA extracts underwent genomic DNA methylation probing by Illumina HumanMethylation450 (M450K) BeadChip, which contains around 450K human CpG marker probe beads. For the samples collected for expression level measurement, we used the isolation kit (mirVana miRNA Isolation Kit, Catalog no. AM1560, Life Technologies, Carlsbad, CA) to extract the RNAs from the samples. The quality and quantity of the total RNAs were estimated by Bioanalyzer (ABI) and Qubit (Thermo) to ensured the RIN values were larger than 7. And around six RNA samples of the same group were evenly pooled to obtain unbiased expression measurement, resulting 3 healthy pools (N = 6, 6, 6), 3 fever pools (N = 6, 6, 6), 9 pre-IVIG pools (N = 6, 6, 6, 6, 6, 6, 6, 5, 3), and 3 post-IVIG pools (N = 6, 6, 6). These sample pools were hybridized on the GeneChip Human Transcriptome Array 2.0 (HTA 2.0, Affymetrix, Santa Clara). The microarray experiment quality control was subjected to criteria proposed in previous studies. The DNA methylation data and microarray data were deposited in NCBI GEO (GSE109430, GSE109351).
Data Preprocessing
Genomic methylation profiling for the four sample groups was measured by M450K BeadChip, as described above. The methylation level of one CpG probe is computed using the β value (β = M / (M+ U + ɑ), where M is the methylated cytosine intensity, U is the unmethylated cytosine probing intensity, and ɑ is the calibration number). The raw data is processed using Partek. Gene expression profiling for pooled sample groups was measured by the Affymetrix HTA 2.0 GeneChip. The mRNA expression level of different human genes is also analyzed and calculated by the commercial microarray data analysis tool Partek.
Differential value comparison of chip beads
We compared the differential methylation/expression between the four sample groups. β values and expression measurements are used to calculate the differential significance between any two sample groups for differential methylation profiling probing and differential expression comparison, respectively. All combinations of any of the two groups from the four experimental samples (healthy subject group, fever patient group, pre-IVIG KD patient group, and the post-IVIG KD patient group) were considered in the data comparison analysis. In KDmarkers, three statistical test results are available for users: the independent t test, the rank-sum test, and the Kolmogorov-Smirnov test. We calculated the p-values against the null hypothesis that the average/median/distribution of Group 1 is smaller/larger than the corresponding statistics of Group 2. Multiple hypotheses bias occurred in the analysis process is corrected using two different ways: the FDR approach and the Bonferroni method.
Bead-gene mapping
After calculating the differential methylation/expression of each bead of the BeadChip/GeneChip microarray, we used the Infinium annotation file/HTA annotation file to map the value reads back to the human genome. Notice that multiple values may be mapped to one gene. And multiple genes may be annotated for one bead value read.
Usage of KDmarkers
Usage of KDmarkers
Three different functions were implemented in KDmarkers to facilitate genome wide KD marker investigation based on the comparison between KD patients and the control subjects. Researchers can analyze the differential methylation pattern and expression level for different human genes to extract potential KD molecular diagnostic kits.
Function 1: Search KD Markers
In this function, users can find potential differentially methylated/expressed genes between KD patients and normal kids.

a) Users need to specify the two groups and the search conditions to search for differentially methylated/expressed genes between these two groups.
b) The differentially methylated genes between the selected two groups. Details of the bead probes can be found by clicking on the bead name.
c) The heat map of the methylation levels between the two groups.
d) Users can click on the tabs to switch the table listing into differentially methylated genes, differentially expressed genes, and genes that are both differentially methylated and expressed.
Function 2: Search Affected Patient Groups
In this function, users can find potentially affected patient groups of the given gene.
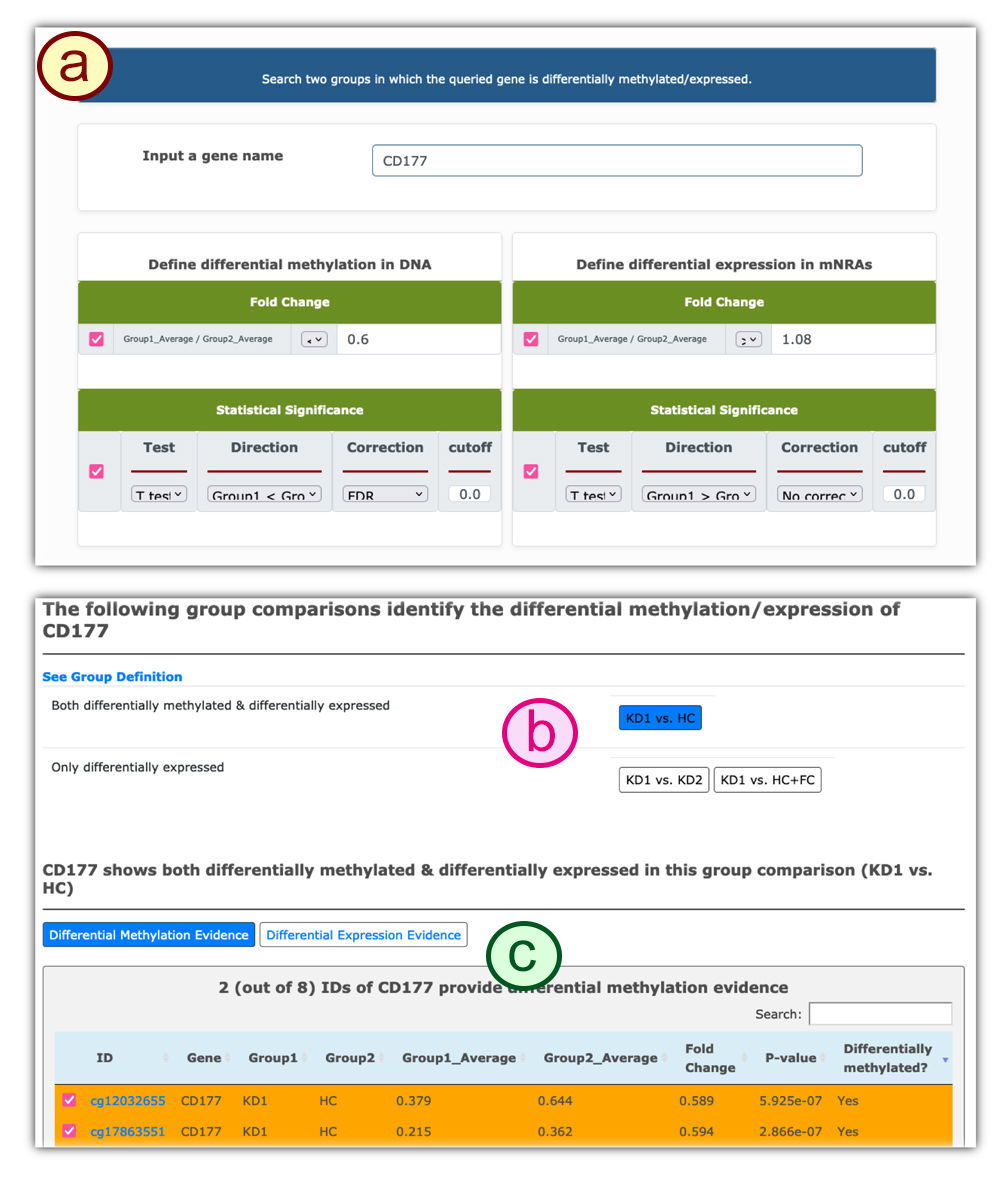
a) Users can type in the gene of interest and the search conditions to find the potentially affected patient groups.
b) The two patient groups that bear differential methylation/expression levels on the given gene.
c) The differentially methylated genes between the selected two groups. Details of the bead probes can be found by clicking on the bead name. Users can click on the tabs to switch the table listing into differentially methylated genes, differentially expressed genes, and genes that are both differentially methylated and expressed.
Function 3: Visualize Raw Data
In this function, users can input the gene of interest and obtain the methylation and expression levels of this gene between different groups.

a) The listing of the beads that are mapped to this gene.
b) A comparison visualization on the methylation/expression levels of the selected bead.
a) The listing of the beads that are mapped to this gene.
b) A comparison visualization on the methylation/expression levels of the selected bead.